This is step 5 of 5 of Hands-On Project 4 for Amazon Web Services. In this step, we look briefly at how to obtain log files you can use to determine the cause of production problems.
View Elastic Beanstalk Logs
The first level of troubleshooting you can do is to view the logs from your environment. Click on Logs within your Elastic Beanstalk environment, then use the Request Logs dropdown to select either the last 100 lines of each log, or full logs:
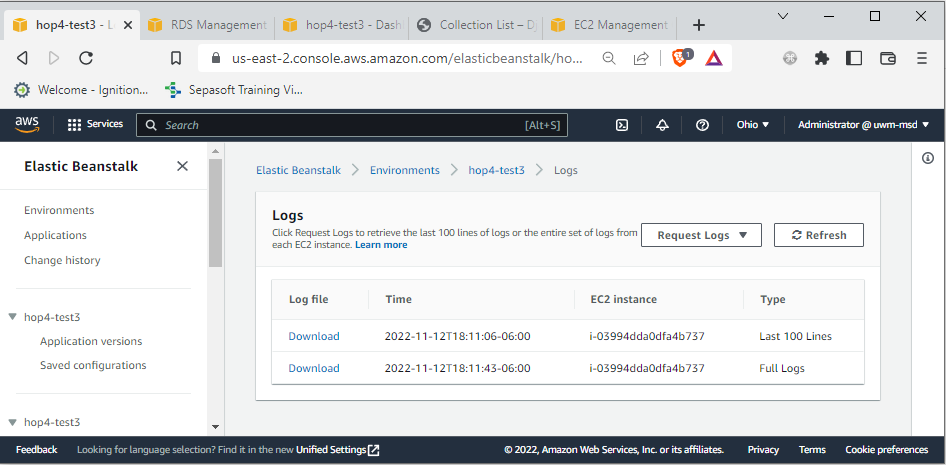
If you select Last 100 Lines, you will only get the latest log data in a single file. Depending on your browser, if you download the Last 100 Lines, you will get either a file download or a display of the last 100 lines of the most relevant logs in your browser.
If you select Full Logs, you will get all log data since the logs were last rotated. With this option, you have a better chance of finding your problem. If you download the logs, you get a zip archive containing all available log files. Within the zip archive, the log folder has the most interesting log files:
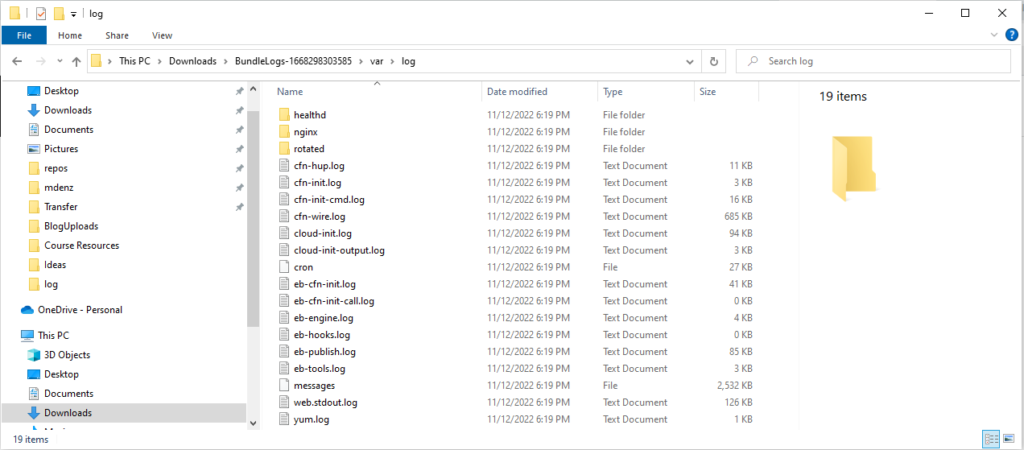
The contents of these log files depends entirely on how Elastic Beanstalk is implemented. An uninitiated person is unlikely to understand their contents easily at first. However, if you did have a deployment problem, it is likely that there are clues to the cause in one or more of these logs. The suggestion is to look at the logs if you have a problem, to see if you can solve it. As you gain more experience with Elastic Beanstalk, it will be easier to determine which logs to look at, and specifically which messages are clues to the cause of the problem.